
House prices in the UK make more sense when you know the place, period and type of home behind each figure. A national average is a starting point, not a valuation for a house on your shortlist. This guide uses the official release available when reviewed on 16 November 2026. It separates published evidence from worked examples and shows how to build a local price comparison. It is about what homes cost and how to assess that cost, not a forecast of where the market will go.
1. What is the average UK house price?
The UK House Price Index reported an average UK house price of £273,000 for August 2026, a provisional estimate published by HM Land Registry on 21 October 2026. Prices were 0.9% higher than a year earlier. These are UK-wide figures for a past reference month, not today’s asking prices. The same release scheduled the September figures for 18 November 2026, after this review date.
Use the official August 2026 UK House Price Index summary to check the original tables, notes and revisions. All official price figures in the next three sections come from that release, published on 21 October 2026. Their coverage and reference periods are stated beside them. Later releases may revise these observations, so keep the release date with any number you save.
When comparing those figures with UK homes for sale, remember that listings describe individual properties at an asking price. A home above the UK average is not automatically overpriced. Nor does a lower figure prove a bargain. Size, location, condition and tenure determine which evidence is useful. Start with a realistic price range for the kind of home you need.
2. Prices across the four UK nations
For August 2026, the official release gave rounded average prices of £294,000 in England, £216,000 in Wales and £198,000 in Scotland. Their annual changes were 0.4%, 3.1% and 2.9% respectively. These provisional country estimates, published on 21 October 2026, show why a single UK figure cannot describe every buyer’s options. They also combine different types and sizes of home within each nation.
Northern Ireland needs a separate date label. In the same 21 October 2026 UK HPI release, its average was £202,000 for Quarter 2, April to June 2026, with annual growth of 9.2%. Its underlying series is quarterly, not a fresh August observation. Do not rank all four nations as if every number describes exactly the same recent month. Check the period before comparing changes.
A country average cannot tell you what a particular town costs. Employment, transport, housing stock and local demand vary within national borders. A city flat and a family house in a smaller town are different purchases. Use these national figures to set context, then narrow your research to the local authority, neighbourhood and property type you can actually consider.
3. Regional gaps are bigger than a headline
The August 2026 regional table, published on 21 October 2026, put London’s average at £554,430 and the North East’s at £165,640. These are English regional estimates, not prices for equivalent houses. London’s annual change was minus 2.2%, while the North East’s was plus 3.2%. A region can have a high price level and falling prices at the same time.
In that same release and reference month, the South East average was £379,953 and the North West average was £220,393. Those figures illustrate the range within England, not a recommendation to move or invest. A lower purchase price may come with different wages, travel costs or job options. Compare the household budget and daily routine in each location rather than price alone.
Even a regional boundary is too broad for an offer. A station-side street can differ from a nearby road with heavy traffic. School access, flood exposure, outside space and building condition can matter. Choose a search area that reflects real alternatives for you. If you widen it to collect more sold evidence, note the compromise instead of treating every sale as equally relevant.
4. Houses and flats need separate comparisons
Across the UK, the August 2026 property-type table published on 21 October 2026 recorded average prices of £443,846 for detached homes, £278,675 for semi-detached homes, £232,505 for terraces and £194,148 for flats or maisonettes. These provisional UK estimates are broad categories. They do not mean a detached home in every town should cost more than every flat elsewhere.
Use the category that matches your target, then check bedrooms and measured floor area. A large flat with a long lease is not directly comparable with a small flat facing costly building work. Likewise, two terraces may differ in extensions, parking or structural condition. Price per square metre can help organise evidence, but only when measurements use a consistent basis and the accommodation is genuinely comparable.
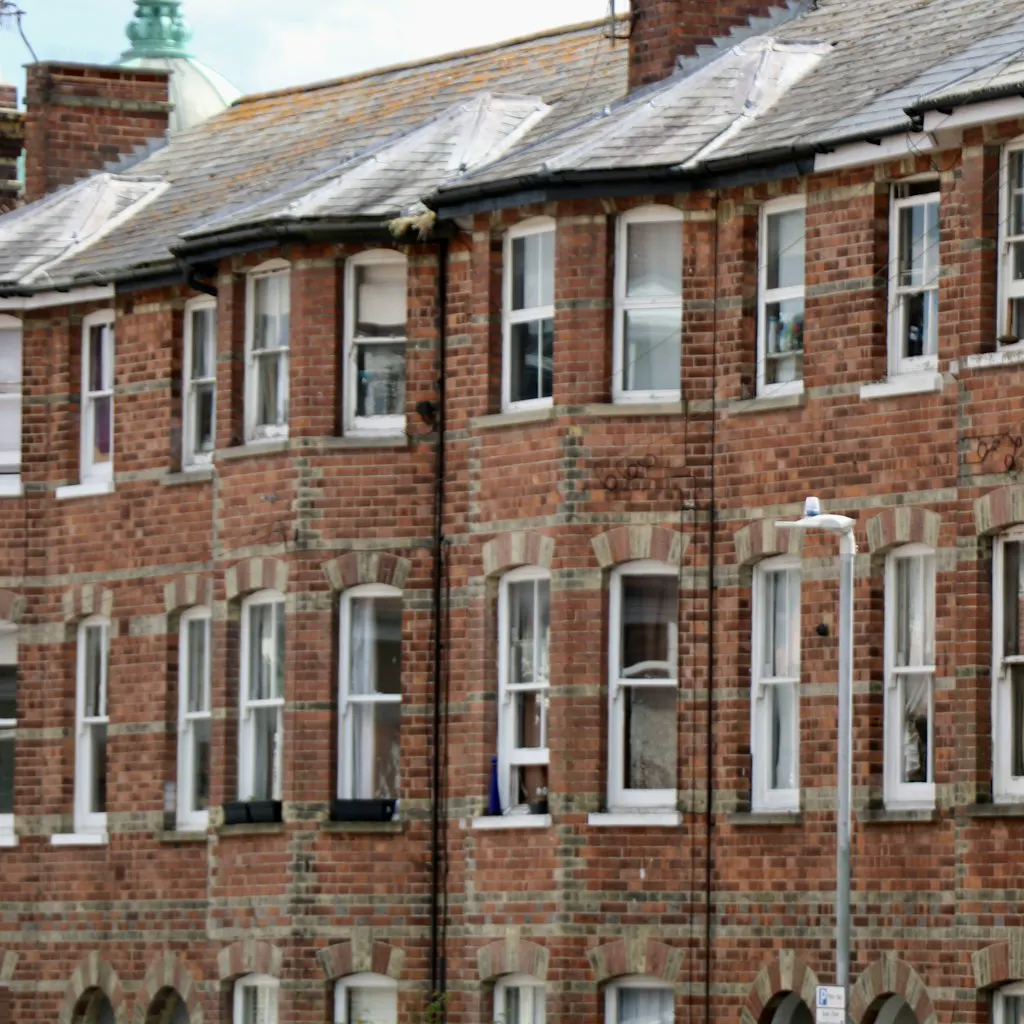
Keep new-build homes separate from established resales where possible. A new home’s asking price may include incentives, specification choices or a completion timetable that an older sale did not. Ask what is included and record any incentive before making a comparison. Photos in this guide show housing variety only; they are not examples of homes sold at the quoted averages.
5. Average, median and index are not the same
In ordinary arithmetic, a mean adds prices and divides by the number of sales. A median is the middle value when sales are sorted by price. The UK HPI headline average is a modelled, mix-adjusted measure, not simply the arithmetic mean or median of that month’s transactions. Its method aims to account for differences in the homes sold, making price changes more useful over time.
Consider a purely illustrative set of five sales: £180,000, £190,000, £200,000, £210,000 and £720,000. The median is £200,000, but the arithmetic mean is £300,000. That example is invented to explain the calculation, not a reported street or official estimate. One expensive sale moves the mean substantially without changing the prices of the other homes.
A local median can describe a typical transaction in a defined sample, but changes may reflect different homes selling. Read the dataset’s definition before comparing it with the UK HPI. The official UK HPI methodology explains the index’s approach. Avoid combining a small-area median, a lender’s average and a portal’s asking-price mean into one apparent trend.

6. Asking prices versus completed sale prices
An asking price is a marketing decision. It can change, attract competing offers or remain above what buyers will pay. An agreed price is further along, but a transaction can still fail. A completed sale records a deal that finished. The UK HPI draws on completed transactions, including cash and mortgage purchases, rather than taking advertised figures as proof of value.
For example, a hypothetical listing reduced from £350,000 to £330,000 is cheaper than its first advertisement. It is not necessarily cheap compared with similar completed sales. The original expectation may have been ambitious, or a survey may reveal work. Record the current asking price, earlier advertisements and relevant sold evidence in separate columns so you do not confuse a discount with an independent valuation.
HM Land Registry’s sold-price search for England and Wales is a useful starting point for individual records. It does not cover Scotland or Northern Ireland; use the relevant local official services there. Check the address, transaction date, property type and tenure, then seek supporting details. A price record alone will not explain the interior condition or every unusual term of a sale.
7. Why official prices arrive with a delay
A buyer may agree a price well before completion. Registration and statistical processing follow later. That sequence means a completed-sale index describes earlier decisions, even when the release is new. Publication month and reference month must both be recorded. Faster asking-price reports can provide a more recent view of seller expectations, but they measure a different stage and cannot replace completed evidence.
Recent UK HPI estimates are provisional because further transactions arrive after the first calculation. New-build evidence can be especially uncertain. A revision does not mean the home you own changed value twice; it means the estimate improved as more information became available. When comparing two releases, check whether the earlier observation was revised rather than calculating a change from mismatched versions.
Monthly changes can also be seasonal. Compare seasonally adjusted figures with seasonally adjusted figures, and unadjusted figures with unadjusted figures. Annual changes compare with a year earlier and answer another question. The index measures nominal prices, before allowing for general inflation. None of these measures tells you the exact price a specific seller would accept this week.
8. Affordability depends on finance as well as price
A price-to-income ratio can describe an area, but it is not a mortgage offer. Check whose earnings are measured, whether the price is a mean or median, and whether the geography and dates match. An individual salary measure should not be presented as a household’s total income. Your usable deposit, existing debts, expenses and lender criteria all affect what you can afford.
For an illustrative repayment mortgage of £240,000 over 25 years, payments would be about £1,267 a month at 4% interest and £1,403 at 5%. These rounded calculations assume monthly payments and an unchanged rate for the whole term, excluding fees. They are not current product quotes. They show why the same purchase price can lead to quite different monthly commitments.
A lower mortgage rate may improve borrowing capacity, but it does not guarantee higher house prices. Lenders price products using several factors, and personal eligibility varies. Ask a regulated adviser to compare total costs and what happens after a fixed deal ends. Keep purchase tax, legal fees, insurance, maintenance and any service charge beside the mortgage payment, rather than spending every available pound on the offer.

9. Build a local evidence sheet before offering
Start with several recent completed sales that share your target’s property type and setting. Record their sale dates, prices, floor areas, tenure, condition and outside space where known. Mark unknown details honestly. Look for the nearest practical alternatives, not just the cheapest examples. If few homes match, widen the date range or area carefully and explain why the comparisons are less reliable.
Next, place current listings beside those sales, clearly labelled as asking prices. Compare the same features and note necessary work. Ask the selling agent which completed comparables support the price. Check old particulars and floor plans where available, while recognising that marketing descriptions can be incomplete. Obtain proper survey or valuation advice when a condition issue or an uncertain value could materially change your decision.
Do not add a national annual percentage mechanically to an old sale and call the result today’s value. Local conditions may have differed, and the property may have changed. Use a reasonable range, explain its limitations and set your maximum from affordability. A well-supported offer can still be rejected; another buyer’s higher bid does not make your financial boundary wrong.
10. Use the evidence without predicting returns
Before making a decision, write a short summary: the official release used, the local sold evidence, the asking-price range and the gaps that remain. Keep facts separate from assumptions. State whether any repair allowance is a quote or only a rough reserve. This makes it easier to explain an offer and revisit it if a survey or legal enquiry changes the information.
Use our first-time buyer budget guide to turn a price range into a fuller cost plan, even if this is not your first purchase. A purchase should remain manageable without relying on future growth. Prices can fall, selling takes time and transaction costs matter. Plan for changes to income or mortgage payments rather than treating a published average as financial protection.
This guide was reviewed on 16 November 2026 using the official release published on 21 October 2026. It will not update itself with each monthly announcement. Check the latest release before relying on a figure for a new decision. For help with a listing, bring your preferred area, property type and comfortable budget; keep personal mortgage, legal, tax and valuation advice with qualified professionals.
Further reading from official sources
Rules, rates and procedures can change. Check the latest primary guidance and speak to a qualified professional about your own purchase.